
Over the past year and a half, I have had the opportunity to monitor wildlife with trail cameras. It has been an interesting project to say the least (and check out my other projects here.)
The data from the trail cameras is being used to tell us what creatures are living in the area. This tells us how healthy the ecosystem is and boost engagement with science.
There are a few things that I have had to learn to make sure that we are getting the right type of data. This means unbiased data and just learning how to use both the camera and data to get the best use out of them.
Site Selection For Trail Cameras
Most important is site selection. If you are trying to see something in particular, try to find either evidence of that creature having been there before, or find an area that meets the requirements of its preferred habitat. If you are curious about what might be using a particular pond or what might be getting in your bins at night, right there at that spot is perfect. The only situation where site selection might not be so intuitive is surveys. If you are taking a survey it is usually best to get a map and randomly select sites from a birds eye view map and then place your cameras in those areas.
Trail Camera Setup
Next is setting up the camera. Every camera is different, but some things will remain the same. If your data needs it, make sure to set the correct date and time before leaving it out. Always make sure the seal to the inside of the camera is good. You don’t want to have any water getting in it because your batteries will leak.
Place your camera low to the ground unless what you are observing specifically requires otherwise. It is important to remember most animals are not very tall. Also secure it tightly. Some animals are curious about the camera, and may munch, sniff, lick or ‘mark’ it. This can knock over or move your camera and leave you with no images at the end.
Another thing I learnt the hard way is to not put the camera directly above an ant hill. The ants will get into the camera and leave bits of wood chips and ant mess all over it. Another issue with some ants is that some are territorial. In other words; they hate you and your camera and will bite you. (Especially if you stand on their nest which is pretty understandable to be honest).
Data
After collecting the cameras comes the tedious task of looking through all the pictures. Then identifying what the animals are and filling out a spreadsheet with the species information. It can be hard sometimes to be able to tell what kind of animal, or exactly what species there are in an image. Extra information like the sex, approximate age etc. can be impossible to determine from some blurred black and white images. I often find myself inputting information like ‘possum sp.’ to indicate that it was a possum, but I don’t know what kind it is.
Other times the camera captures great images and you can use context to determine information. I have been fortunate enough to capture images and video of a mother swamp wallaby and her brand new baby. The baby was adorable and only the size of a small house cat. From this information I can determine that the mother wallaby is female, of reproductive age, likely still feeding. The joey of course would be juvenile age. All useful information to add to the spreadsheet. It is also very cute and exciting to see a healthy, growing wallaby population so close to suburbia.
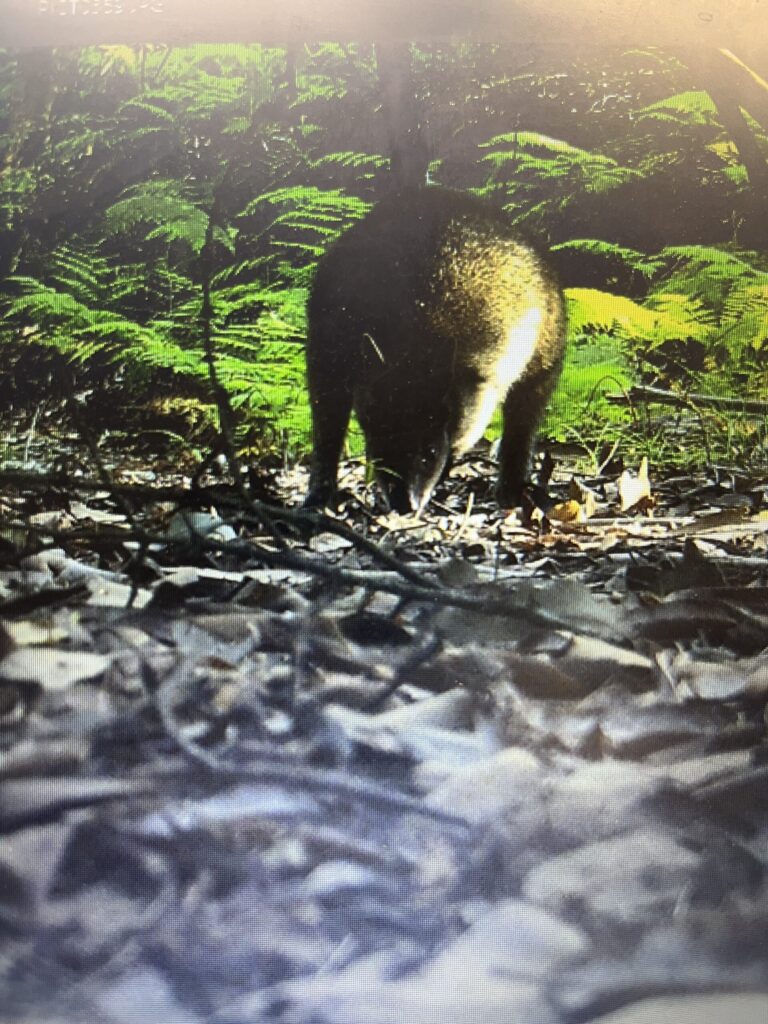
Image of swamp wallaby from trail camera
Uses For Data
When it comes to data, I upload mine to the Atlas of Living Australia. In general, it is good to have an accurate name. With ALA data, all the names have to match their data base. Check the reference sheet for how to fill in the spread sheet if this is also what you are doing. For example I had entered brush turkeys as ‘Alectura lathami’ but what would have been more appropriate for that spreadsheet was ‘Alectura lathami lathami’ in this instance.
Aside from the ALA spreadsheet, I also have my own. It is for the most part identical to the ALA one, but has extra columns and graphs for data analysis.
I use this to do things like add extra columns for what month animals were spotted in to determine if there is any seasonality to species activity, make graphs to show which animals are most active, or calculate biodiversity indexes. This is only for my own personal interest so I can practice research skills and answer my own questions the wildlife. However this does come in handy when anyone may need a graph or some interesting statistics or images to aid their discussion of the nearby wildlife.
If you chose to upload your data to something like ALA, it can be used by researchers and students to analyse our wildlife. It is important to have reliable and plentiful data to help protect wildlife, educate ourselves on their needs and can help protect them for the future. Interesting citizen science projects for environmental science that you can contribute to using this kind of data are ALA and iNaturalist.
Leave a Reply